Types of Graphs
Rezult’s Score History shows two different graphs for each Event Style, monthly and daily.
Monthly Graph
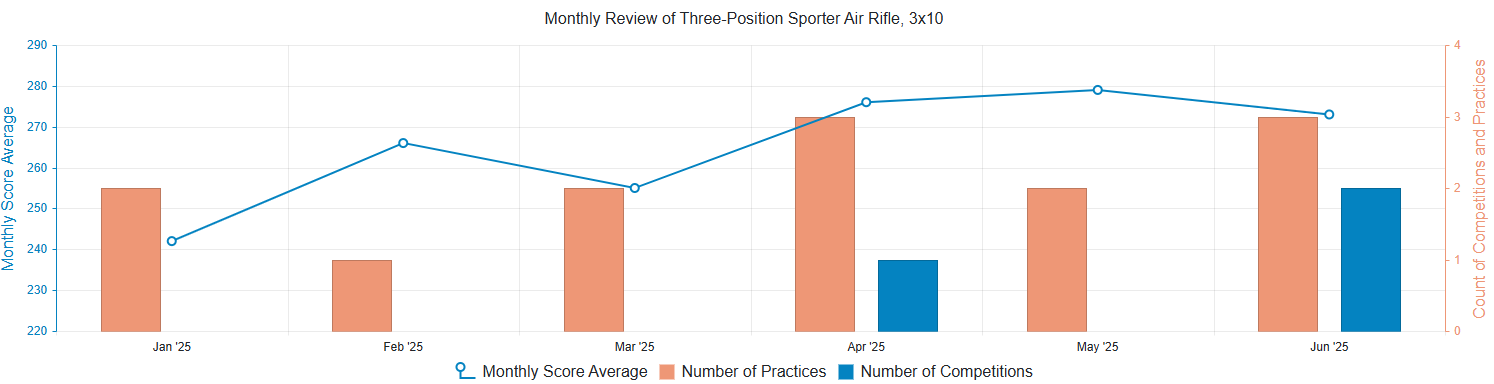
The monthly graphs shows the number of practices and the number of competitions as a bar graph. The line graph tracks the average score the marksman shot each month.
Users may click on the monthly bar graph or the line graph to bring up details (the daily graph) for any month.
Daily Graph
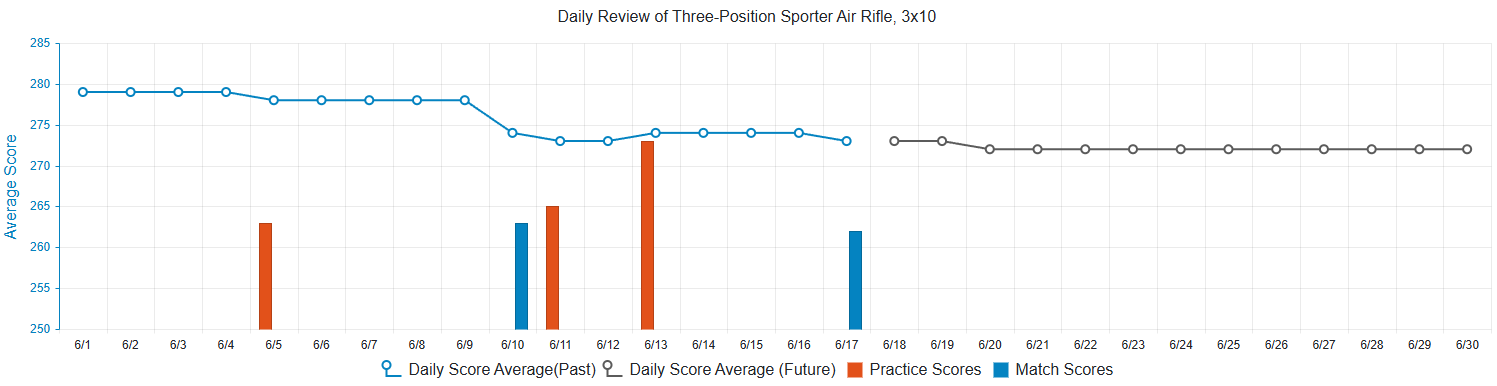
The daily graph shows a running score average in the line graph. The bar graph shows each day the marksmen shot, competition and practice, and their amortized score.
Opening an Event Style Graph
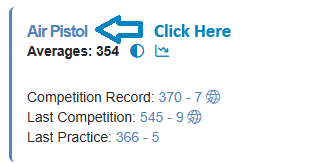
To open an Event Style graph, click on the Event Style name from your Event Style Subscription cards.
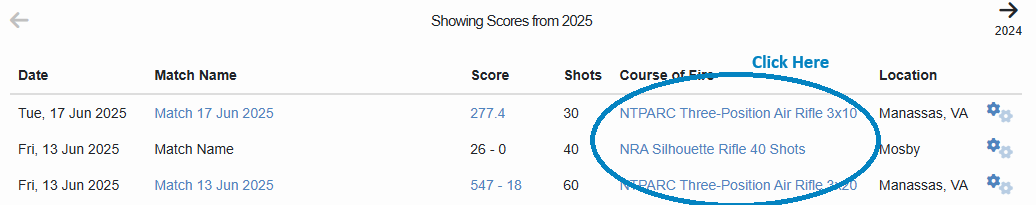
Or click on the Course of Fire name from your Score History list.