"Shot Group Analysis" is an exciting feature, found only in Orion, that helps athletes better understand how they are shooting. When a athlete only shoots one shot per aiming bull it is difficult for him or her to know if his or her group is centered, what shape the group is in, or how big or small the group is. Shot group analysis uses statistical analysis techniques to calculate and display an athlete's core group.
Score is only one method for a athlete to know how well he or she is doing. Score alone does not tell an athlete or coach much information about what needs to be improved. Alternatively, shot group analysis can tell a athlete where his or her group is centered, if the group round or elongated, and how large the group is. Orion displays this information both graphically and analytically in the individual score report or the in-program shot group form.
Example Analysis
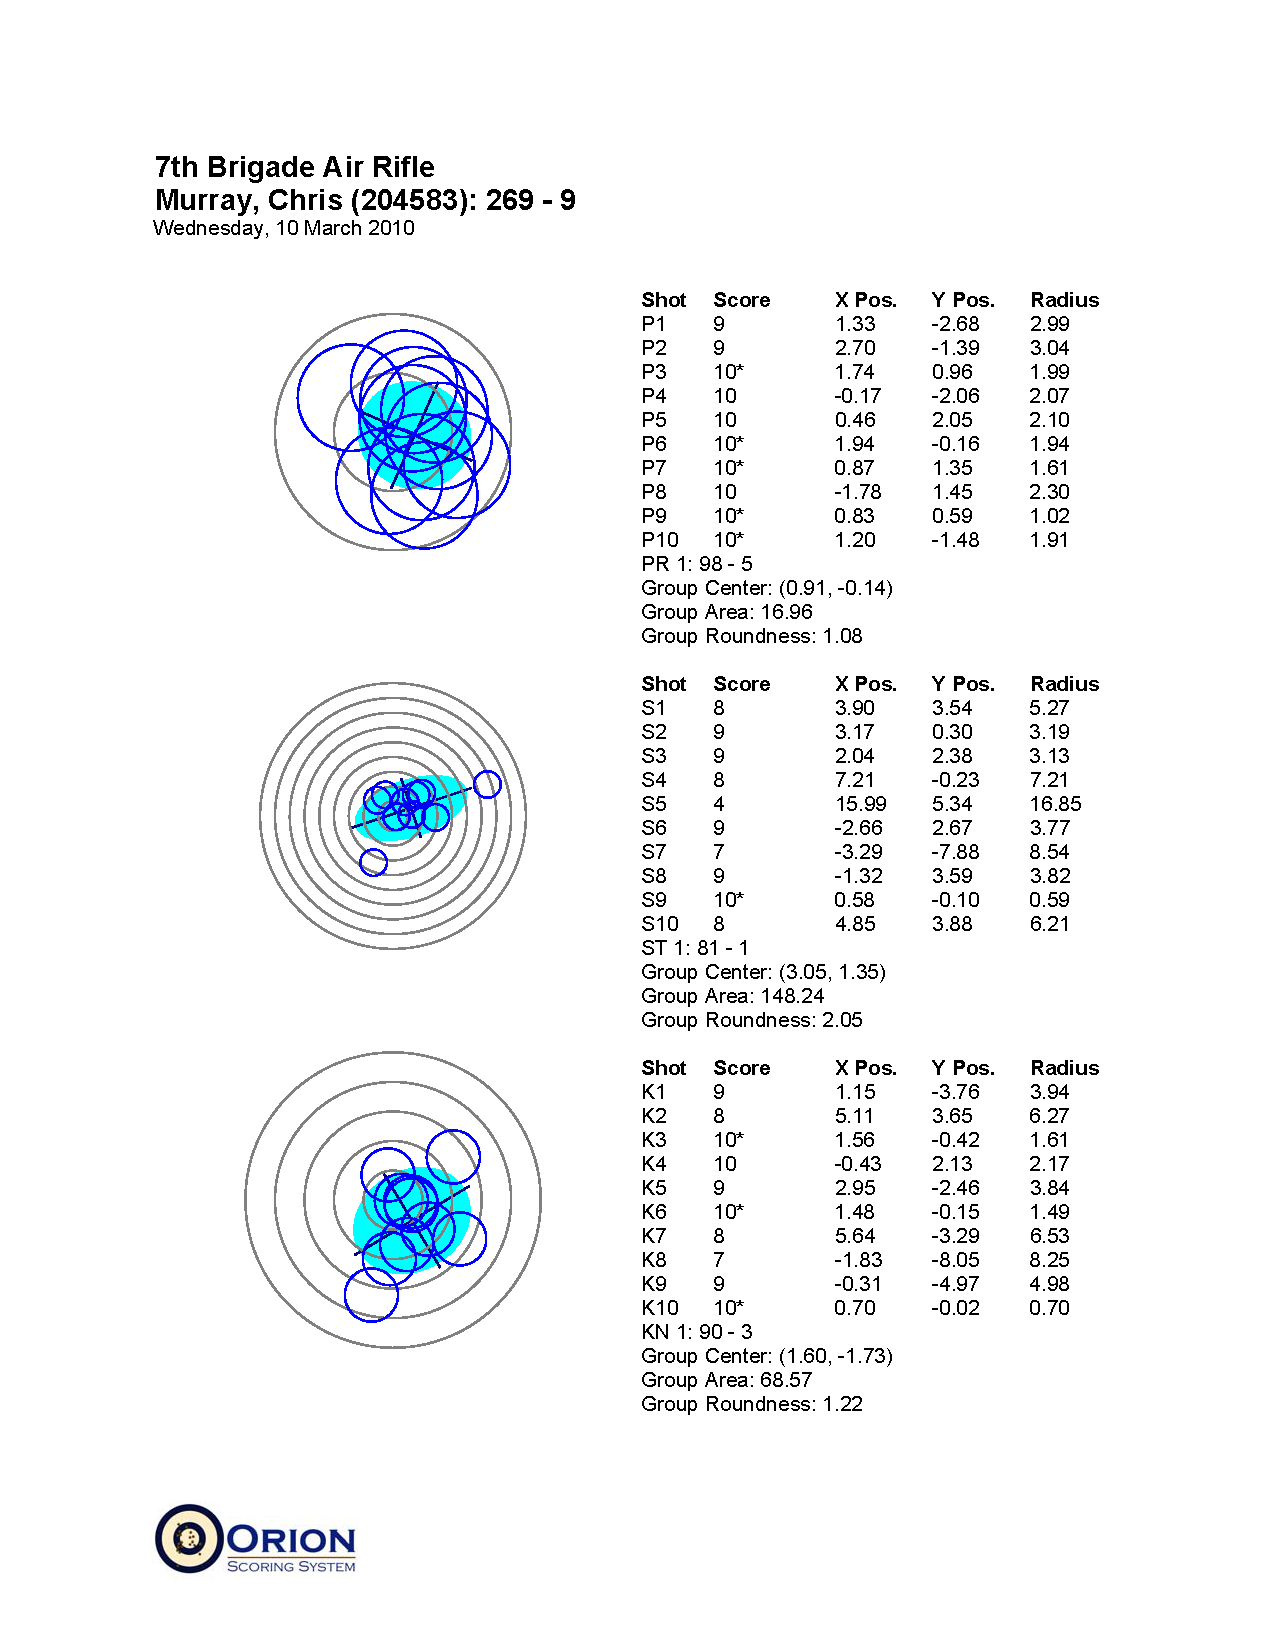
Consider the following information that can be learned from this report.
•In prone, the athlete has a very round group (Roundness factor of 1.08) typical of a solid well built position. However, due to the size of the group, the athlete may benefit from better ammunition or cleaning his rifle.
•In standing, the athlete had two outliers from his main group. Outliers like this could have many causes, including shooting too quickly without an adequate pre-shot routine, over holding, or fundamental position problems. Its important to talk with your athlete to help determine the root cause.
•In kneeling, the athlete has a fairly round group but is centered off at the edge of the nine ring. He could of have a few extra points by paying more attention to his sighters and correlating his called shots with his actual shots and then making appropriate sight adjustments.
Understanding the Metrics
•Graphically, the light shaded blue ellipse is the athlete's statistical representation of his or her group. It displays the area that 90\% of a athlete's shots were statistically located within.
•The lines within the shot group ellipse are the major and minor axes, and correspond to the center of the group.
•Orion uses a Bivariate Normal Distribution to model the shot group. Some people will refer to this as a two dimensional Gaussian distribution. Practically this means that the shot group analysis is based on all shots fired.
•Group Center is the statistical center of the shot group. The first number is the X-coordinate center, the second number if the Y-coordinate center. Both numbers are in millimeters. Group Center is largely influenced by the athlete's ability to center his or her group, that is, calling shots and making appropriate sight adjustments to the actual shot location.
•Group Area is the size of the statistical representation of the shot group. It is also the size of the shot group ellipse. This is measured in millimeters squared. Group Area is largely influenced by the athlete's inner position (the static muscular forces used to hold the gun still) and gun ammo combinations.
•Group Roundness is a unit-less metric measuring how round the shot group is. A shot group with roundness 1.00 is perfectly round. A roundness value greater than 1 is more elongated along the X-axis, less then 1 the group is more elongated along the Y-axis. Groups with a roundness between .75 and 1.50 may generally be considered round. Group Roundness is mostly influenced by an athlete's outer position. The more well built a position is the more round the group will be. Natural point of aim can also influence Group Roundness. In pistol shooting groups elongated along the Y-axis are usual indicative of poor sight alignment.